
Table 1. Number of observation wells measured for the water-level comparison
           periods-1980 to 1996 and 1995 to 1996
                     Number of observation wells measured
                    -------------------------------------
State                 1980 and 1996        1995 and 1996
-------------------------------------------------------------
Colorado                   495                   562
Kansas                     809                 1,002
Nebraska                 1,892                 2,664
New Mexico                 159                   157
Oklahoma                   193                   296
South Dakota                37                   103
Texas                    1,825                 2,608
Wyoming                     19                    75
-------------------------------------------------------------
High Plains              5,429                 7,467
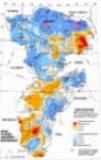
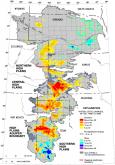 (Click on image or click here to download a high resolution PDF version of the figure).
Figure 1. Water-level changes in the High Plains aquifer, 1980 to 1996.
Table 2. Characteristics of the High Plains aquifer in 1980 and water-level
           changes in the High Plains aquifer, predevelopment to 1980, 1980
           to 1996, and 1995 to 1996

[ft, foot; ft/yr, foot per year]
                                                     Average area-weighted water-level change
                                              ------------------------------------------------------
                                              Predevelopment(1940)
                                                  to 1980               1980 to 1996    1995 to 1996
                                              ------------------------------------------------------
                         Percentage of total                              Water-             Water-
           Percentage    volume of drainable                   Rate of    level   Rate of    level
           of total       water in storage       Water-level   change     change  change     change
 State    aquifer area1       in 19801            change(ft)   (ft/yr)     (ft)   (ft/yr)     (ft)
-------------------------------------------------------------------------------------------------------------
Colorado       8.6             3.7                 -4.2        -0.10       -4.7    -0.29     -0.12
Kansas        17.5             9.9                 -9.9        -0.25       -7.7    -0.48     -0.50
Nebraska      36.6            65.5                  0.0         0.00       +1.6    +0.10     -0.10
New Mexico     5.4             1.5                 -9.8        -0.25       -6.2    -0.39     -1.22
Oklahoma       4.2             3.4                -11.3        -0.28       -3.7    -0.23     -0.97
South Dakota   2.7             1.8                  0.0         0.00       -0.8    -0.05     +0.74
Texas         20.4            12.0                -33.7        -0.84       -6.1    -0.38     -1.44
Wyoming        4.6             2.2                  0.0         0.00       -1.9    -0.12     +0.28
-------------------------------------------------------------------------------------------------------------
High Plains    100             100                 -9.9        -0.25       -2.8    -0.18     -0.49
-------------------------------------------------------------------------------------------------------------
     1From Gutentag and others(1984, p. 47).
Table 3. Average area-weighted precipitation and comparison to 30-year
           normal precipitation (1961-90) in the High Plains region, 1995 and 1981 to 1995

[Data from National Oceanic and Atmospheric Administration, National Climatic Data
Center, Asheville, North Carolina; data values are in inches]
                            1995                            1981-95
                 -----------------------------    -----------------------------
                                   Departure        Average         Departure
                     Average      from 30-year       annual        from 30-year
State             Precipitation      normal       precipitation       normal
-------------------------------------------------------------------------------
Colorado              19.60          +3.35            17.44           +1.19
Kansas                22.78          +1.47            22.30           +0.99
Nebraska              24.45          +2.67            23.21           +1.43
New Mexico            13.98          -2.41            17.80           +1.40
Oklahoma              20.23          +0.29            20.90           +0.95
South Dakota          26.34          +7.96            20.25           +1.87
Texas                 19.33          +0.52            20.14           +1.33
Wyoming               19.35          +4.92            15.56           +1.13
-------------------------------------------------------------------------------
High Plains           21.78          +1.97            21.10           +1.29
-------------------------------------------------------------------------------
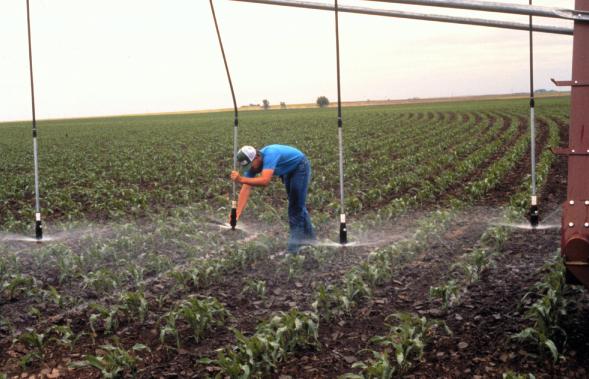
Figure 2. Low pressure nozzles and drop tubes on a center pivot in southwestern Nebraska
           (Photo courtesy of Gary Lee, U.S. Department of Agriculture, Natural Resources
           Conservation Service).
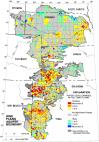 (Click on image or click here to download a high resolution PDF version of the figure).
Figure 3. Water-level changes in the High Plains aquifer, 1995 to 1996.
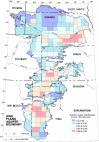 (Click on image or click here to download a high resolution PDF version of the figure).
Figure 4. Fresh ground-water withdrawal rates by county during 1995 (data from U.S
            Geological Survey Aggregate Water-Use Data System, data retrieved April 1998).
 (Click on image or click here to download a high resolution PDF version of the figure).
Figure 5. Annual precipitation, 1995, and departure from 30-year normal precipitation (1961-90)
            (precipitation data from the National Oceanic and Atmospheric Administration, National
            Climatic Data Center, Asheville, North Carolina).
Table 4. Average area-weighted saturated thickness of the High Plains
           aquifer, predevelopment, 1980, and 1996
 ----------------------------------------------------------------------------------
                              Average area-weighted saturated thickness
                           --------------------------------------------------------
                                               1980, as a            1996, as a
                                                percent-              percent-
                               Pre-             age of                age of
                             develop-            pre-                  pre-
                              ment      1980    develop-    1996      develop-
   State                     (feet)    (feet)    ment      (feet)      ment
-----------------------------------------------------------------------------------
Colorado                      83.2      79.0      95        74.3        89
Kansas                       110.9     101.0      91        93.2        84
Nebraska                     342.0     342.0     100       343.6       100
New Mexico                    60.8      51.0      84        45.5        75
Oklahoma                     141.3     130.0      92       126.6        90
South Dakota                 207.6     207.0     100       206.2        99
Texas                        143.7     110.0      77       103.9        72
Wyoming                      182.0     182.0     100       180.1        99
-----------------------------------------------------------------------------------
High Plains                  199.9     190.0      95       187.2        94
-----------------------------------------------------------------------------------
SELECTED REFERENCES

Gutentag, E.D., Heimes, F.J., Krothe, N.C., Luckey, R.R., and Weeks, J.B., 1984, Geohydrology
   of the High Plains aquifer in parts of Colorado, Kansas, Nebraska, New Mexico, Oklahoma,
   South Dakota, Texas, and Wyoming: U.S. Geological Survey Professional Paper 1400-B, 63 p.

Luckey, R.R., Gutentag, E.D., and Weeks, J.B., 1981, Water-level and saturated-thickness
   changes, predevelopment to 1980, in the High Plains aquifer in parts of Colorado,
   Kansas, Nebraska, New Mexico, Oklahoma, South Dakota, Texas, and Wyoming: U.S.
   Geological Survey Hydrologic Investigations Atlas HA-652, 2 sheets, scale 1:2,500,000.

National Oceanic and Atmospheric Administration, 1951-95, Climatological data by state,
   monthly and annual summaries: Asheville, N.C., National Climatic Center.

Thelin, G.P., and Heimes, F.J., 1987, Mapping irrigated cropland from Landsat data for
   determination of water use from the High Plains aquifer in parts of Colorado, Kansas,
   Nebraska, New Mexico, Oklahoma, South Dakota, Texas, and Wyoming: U.S. Geological Survey
   Professional Paper 1400-C, 38 p.
For more information, please contact:
District Chief
U.S. Geological Survey
Room 406 Federal Building
100 Centennial Mall North
Lincoln, Nebraska 68508
(402) 437-5082
http://www-ne.cr.usgs.gov

 You are Visitor No:
|
 : GS-W-NE_Webmaster@usgs.gov