
Table 1. Number of High Plains aquifer wells measured for 1996 and 1997 and
used for the water-level comparison periods-1980 to 1997 and 1996 to 1997.
-----------------------------------------------------------------------
                         Wells              Wells used for water-level
                     measured for:             comparison periods
     State    ---------------------------------------------------------
                   1996        1997       1980 to 1997    1996 to 1997
-----------------------------------------------------------------------
Colorado            604         604           502            579
Kansas            1,174       1,298           755            889
Nebraska          3,490       3,617         1,937          3,401
New Mexico          751         547           168            104
Oklahoma            298         268           171            256
South Dakota        114         105            70            100
Texas             2,903       2,581         1,617          2,364
Wyoming              83          63            13             62
-----------------------------------------------------------------------
High Plains       9,417       9,083         5,233          7,755
 (Click on image or click here to download a high resolution PDF version of the figure) Requires Adobe Acrobat Reader.
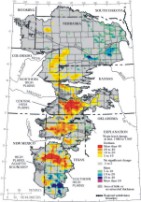
Figure 1. Water-level changes in the High Plains aquifer, 1980 to 1997.
Table 2. Characteristics of the High Plains aquifer in 1980 and water-level
changes in the High Plains aquifer, predevelopment to 1980, 1980 to 1997,
and 1996 to 1997.
[ft, foot; ft/yr, foot per year]
Average area-weighted water-level change
-------------------------------------------
Percentage Predevelopment 1996 to
of total 1950 to 1980 1980 to 1997 1997
volume of -------------------------------------------
Percentage drainable Water- Water- Water-
of total water in level Rate of level Rate of level
aquifer storage changeł change change change change
State areaą in 1980˛ (ft) (ft/yr) (ft) (ft/yr) (ft)
----------------------------------------------------------------------------
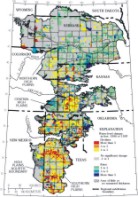
Colorado 8.2 3.7 -4.2 -0.14 -5.9 -0.35 +0.15
Kansas 16.2 9.9 -9.9 -0.33 -8.0 -0.47 +0.23
Nebraska 38.6 65.5 0.0 0.00 +2.3 +0.13 +0.58
New Mexico 3.6 1.5 -9.8 -0.33 -4.0 -0.23 -0.65
Oklahoma 4.2 3.4 -11.3 -0.38 -2.7 -0.16 +0.70
South Dakota 2.9 1.8 0.0 0.00 +3.1 +0.18 +0.82
Texas 21.5 12.0 -33.7 -1.12 -7.4 -0.43 -0.98
Wyoming 4.8 2.2 0.0 0.00 -1.5 -0.09 -0.24
----------------------------------------------------------------------------
High Plains 100 100 -9.9 -0.33 -2.7 -0.16 +0.08
----------------------------------------------------------------------------
ą Does not include areas of little or no saturated thickness.
˛ Modified from Gutentag and others (1984).
ł Luckey and others (1981).
Table 3. Average area-weighted precipitation and comparison to 30-year normal
precipitation (1961-90) in the High Plains region, 1981 to 1996, and 1996.
[Data from National Oceanic and Atmospheric Administration, National Climatic
Data Center, Asheville, North Carolina; data values are in inches per year]
                    1981 to 1996                       1996
              --------------------------   -----------------------------
                            Departure                      Departure
               Average      from 30-year     Average       from 30-year
State        Precipitation  normal         precipitation   normal
------------------------------------------------------------------------
Colorado          17.5       +1.3               19.0        +2.8
Kansas            22.6       +1.3               26.7        +5.4
Nebraska          23.3       +1.5               24.1        +2.3
New Mexico        17.6       +1.3               15.4        -1.0
Oklahoma          21.3       +1.3               25.3        +5.3
South Dakota      20.3       +2.0               22.4        +4.0
Texas             20.1       +1.2               18.6        -0.3
Wyoming           15.6       +1.1               13.6        -0.9
-------------------------------------------------------------------------
High Plains       21.2       +1.4               22.0        +2.2
-------------------------------------------------------------------------
 (Click on image or click here to download a high resolution PDF version of the figure) Requires Adobe Acrobat Reader.
Figure 2. Generalized water-level changes in the High Plains aquifer,
1996 to 1997.
 (Click on image for a larger version or click here to download a high resolution PDF version of the figure) Requires Adobe Acrobat Reader.
 (Click on image or click here to download a high resolution PDF version of the figure) Requires Adobe Acrobat Reader
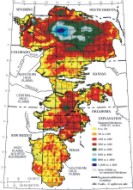
Figure 4. Saturated thickness of the High Plains aquifer, 1996-97
(modified from Weeks and Gutentag, 1981).
Table 4. Saturated-thickness distribution in the High Plains aquifer,
1980 and 1996-97.
[ft, feet; < , less than]
Area of Percentage of area within each saturated
High Plains thickness interval
aquifer -------------------------------------------------
within 0-100 ft 100- 200- 400- 600- 800-
Stateą --------------------- 200 400 600 800 1,200
State (mi˛ ) Year˛ 0-50 ft 0-100 ft ft ft ft ft ft
----------------------------------------------------------------------------
Colorado 14,900 1980 76 18 6 -- -- --
1996-97 58 23 15 4 -- -- --
Kansas 30,500 1980 66 21 12 1 -- --
1996-97 51 19 18 11 1 -- --
Nebraska 63,650 1980 14 21 29 22 10 4
1996-97 9 8 20 28 22 9 4
New Mexico 9,450 1980 85 15 -- -- -- --
1996-97 72 17 11 -- -- -- --
Oklahoma 7,350 1980 58 25 11 6 -- --
1996-97 35 21 28 12 4 -- --
S. Dakota 4,750 1980 44 13 25 18 -- --
1996-97 26 12 15 32 15 -- --
Texas 35,450 1980 61 25 14 -- -- --
1996-97 33 32 <23 12 <1 -- --
Wyoming 8,000 1980 46 26 18 4 4 2
1996-97 41 7 28 16 <5 <4 <1
----------------------------------------------------------------------------
High 174,050 1980 46 22 18 9 4 1
Plains 1996-97 32 17 20 17 9 4 1
----------------------------------------------------------------------------
ą Luckey and others (1981), includes areas of little or no saturated
thickness.
˛ All 1980 values are from Gutentag and others (1984).
SELECTED REFERENCES

Gutentag, E.D., Heimes, F.J., Krothe, N.C., Luckey, R.R., and Weeks, J.B.,
   1984, Geohydrology of the High Plains aquifer in parts of Colorado,
   Kansas, Nebraska, New Mexico, Oklahoma, South Dakota, Texas, and Wyoming:
   U.S. Geological Survey Professional Paper 1400-B, 63 p.

Luckey, R.R., Gutentag, E.D., and Weeks, J.B., 1981, Water-level and
   saturated-thickness changes, predevelopment to 1980, in the High Plains
   aquifer in parts of Colorado, Kansas, Nebraska, New Mexico, Oklahoma,
   South Dakota, Texas, and Wyoming: U.S. Geological Survey Hydrologic
   Investigations Atlas HA-652, 2 sheets, scale 1:2,500,000.

National Oceanic and Atmospheric Administration, 1951-96, Climatological
   data set TD-3220: Asheville, N.C., National Climatic Center.

Thelin, G.P., and Heimes, F.J., 1987, Mapping irrigated cropland from Landsat
   data for determination of water use from the High Plains aquifer in parts
   of Colorado, Kansas, Nebraska, New Mexico, Oklahoma, South Dakota, Texas,
   and Wyoming: U.S. Geological Survey Professional Paper 1400-C, 38 p.

Weeks, J.B., and Gutentag, E.D., 1981, Bedrock geology, altitude of base, and
   1980 saturated thickness of the high Plains aquifer in parts of Colorado,
   Kansas, Nebraska, New Mexico, Oklahoma, South Dakota, Texas, and Wyoming:
   U.S. Geological Survey Hydrologic Investigations Atlas HA-648, 2 sheets,
   scale 1:2,500,000.
For more information, please contact:
District Chief
U.S. Geological Survey
Room 406 Federal Building
100 Centennial Mall North
Lincoln, Nebraska 68508
(402) 437-5082
http://www-ne.cr.usgs.gov
 html, which you are presently viewing, and
 PDF VERSION of FS 124-99:
requires Adobe Acrobat Reader
PDF VERSION of FS 124-99:
requires Adobe Acrobat Reader
 :GS-W-NE_Webmaster@usgs.gov